
Page 89 - BACC Report
P. 89
Draft Report on European Baccalaureate 2020
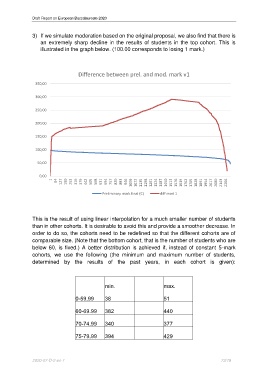
3) If we simulate moderation based on the original proposal, we also find that there is
an extremely sharp decline in the results of students in the top cohort. This is
illustrated in the graph below. (100.00 corresponds to losing 1 mark.)
Difference between prel. and mod. mark v1
350,00
300,00
250,00
200,00
150,00
100,00
50,00
0,00
64 127 190 253 316 379 442 505 568 631 694 757 820 883 946 1009 1072 1135 1198 1261 1324 1387 1450 1513 1576 1639 1702 1765 1828 1891 1954 2017 2080 2143 2206
1
Preliminary mark final (C) diff mod 1
This is the result of using linear interpolation for a much smaller number of students
than in other cohorts. It is desirable to avoid this and provide a smoother decrease. In
order to do so, the cohorts need to be redefined so that the different cohorts are of
comparable size. (Note that the bottom cohort, that is the number of students who are
below 60, is fixed.) A better distribution is achieved if, instead of constant 5-mark
cohorts, we use the following (the minimum and maximum number of students,
determined by the results of the past years, in each cohort is given):
min. max.
0-59.99 38 51
60-69.99 382 440
70-74.99 340 377
75-79.99 394 429
2020-07-D-2-en-1 73/79