
Page 88 - BACC Report
P. 88
Draft Report on European Baccalaureate 2020
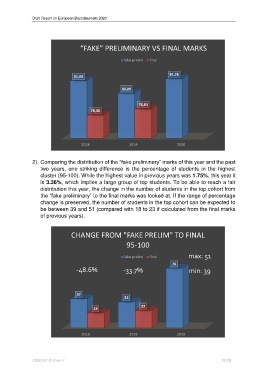
“FAKE” PRELIMINARY VS FINAL MARKS
fake prelim final
81,26
81,09
80,09
78,84
78,36
2018 2019 2020
2) Comparing the distribution of the “fake preliminary” marks of this year and the past
two years, one striking difference is the percentage of students in the highest
cluster (95-100). While the highest value in previous years was 1.75%, this year it
is 3.36%, which implies a large group of top students. To be able to reach a fair
distribution this year, the change in the number of students in the top cohort from
the “fake preliminary” to the final marks was looked at. If the range of percentage
change is preserved, the number of students in the top cohort can be expected to
be between 39 and 51 (compared with 18 to 23 if calculated from the final marks
of previous years).
CHANGE FROM "FAKE PRELIM" TO FINAL
95-100
fake prelim final max: 51
76
-48.6% -33.7% min: 39
37
33
22
19
2018 2019 2020
2020-07-D-2-en-1 72/79