
Page 86 - BACC Report
P. 86
Draft Report on European Baccalaureate 2020
will be the lowest in the 60 to 64.99 cohort. Denote the mean of the two numbers by
. Repeat this process with 65, 70, etc.
60
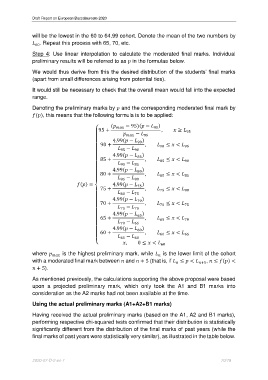
Step 4: Use linear interpolation to calculate the moderated final marks. Individual
preliminary results will be referred to as in the formulae below.
We would thus derive from this the desired distribution of the students’ final marks
(apart from small differences arising from potential ties).
It would still be necessary to check that the overall mean would fall into the expected
range.
Denoting the preliminary marks by and the corresponding moderated final mark by
(), this means that the following formula is to be applied:
( − 95)( − )
95 + 95 , ≥ 95
− 95
90 + 4.99( − ) , ≤ <
90
95 − 90 90 95
4.99( − )
85 + 85 , 85 ≤ < 90
90 − 85
80 + 4.99( − ) , ≤ <
80
85 − 80 80 85
() = 4.99( − )
75
75 + , 75 ≤ < 80
80 − 75
70 + 4.99( − ) , ≤ <
70
75 − 70 70 75
4.99( − )
65 + − 65 , 65 ≤ < 70
70 65
60 + 4.99( − ) , ≤ <
60
65 − 60 60 65
{ , 0 ≤ <
60
where is the highest preliminary mark, while is the lower limit of the cohort
with a moderated final mark between and + 5 (that is, if ≤ < +5 , ≤ () <
+ 5).
As mentioned previously, the calculations supporting the above proposal were based
upon a projected preliminary mark, which only took the A1 and B1 marks into
consideration as the A2 marks had not been available at the time.
Using the actual preliminary marks (A1+A2+B1 marks)
Having received the actual preliminary marks (based on the A1, A2 and B1 marks),
performing respective chi-squared tests confirmed that their distribution is statistically
significantly different from the distribution of the final marks of past years (while the
final marks of past years were statistically very similar), as illustrated in the table below.
2020-07-D-2-en-1 70/79