
Page 85 - BACC Report
P. 85
Draft Report on European Baccalaureate 2020
for moderation of the results. Once this decision is made, we would reach the desired
number of students with the marks 0 to 59.99, 60 to 64.99, etc.
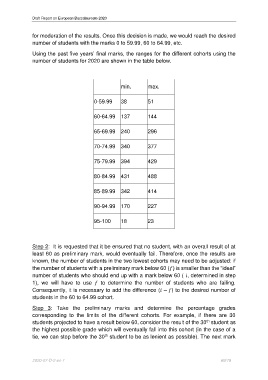
Using the past five years’ final marks, the ranges for the different cohorts using the
number of students for 2020 are shown in the table below.
min. max.
0-59.99 38 51
60-64.99 137 144
65-69.99 240 296
70-74.99 340 377
75-79.99 394 429
80-84.99 431 488
85-89.99 342 414
90-94.99 170 227
95-100 18 23
Step 2: It is requested that it be ensured that no student, with an overall result of at
least 60 as preliminary mark, would eventually fail. Therefore, once the results are
known, the number of students in the two lowest cohorts may need to be adjusted: if
the number of students with a preliminary mark below 60 () is smaller than the “ideal”
number of students who should end up with a mark below 60 ( , determined in step
1), we will have to use to determine the number of students who are failing.
Consequently, it is necessary to add the difference ( − ) to the desired number of
students in the 60 to 64.99 cohort.
Step 3: Take the preliminary marks and determine the percentage grades
corresponding to the limits of the different cohorts. For example, if there are 30
students projected to have a result below 60, consider the result of the 30 student as
th
the highest possible grade which will eventually fall into this cohort (in the case of a
tie, we can stop before the 30 student to be as lenient as possible). The next mark
th
2020-07-D-2-en-1 69/79