
Page 84 - BACC Report
P. 84
Draft Report on European Baccalaureate 2020
To test whether uniform moderation (where every student's final mark is decreased by
the same percentage to guarantee an ideal mean) could be used, the distributions
were compared.
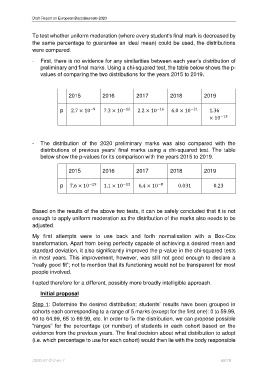
- First, there is no evidence for any similarities between each year’s distribution of
preliminary and final marks. Using a chi-squared test, the table below shows the p-
values of comparing the two distributions for the years 2015 to 2019.
2015 2016 2017 2018 2019
p 2.7 × 10 7.3 × 10 −12 2.2 × 10 −16 6.0 × 10 −21 1.36
−9
× 10 −13
- The distribution of the 2020 preliminary marks was also compared with the
distributions of previous years’ final marks using a chi-squared test. The table
below show the p-values for its comparison with the years 2015 to 2019.
2015 2016 2017 2018 2019
−8
p 7.6 × 10 −29 1.1 × 10 −13 6.4 × 10 0.031 0.23
Based on the results of the above two tests, it can be safely concluded that it is not
enough to apply uniform moderation as the distribution of the marks also needs to be
adjusted.
My first attempts were to use back and forth normalisation with a Box-Cox
transformation. Apart from being perfectly capable of achieving a desired mean and
standard deviation, it also significantly improved the p-value in the chi-squared tests
in most years. This improvement, however, was still not good enough to declare a
“really good fit”; not to mention that its functioning would not be transparent for most
people involved.
I opted therefore for a different, possibly more broadly intelligible approach.
Initial proposal
Step 1: Determine the desired distribution: students’ results have been grouped in
cohorts each corresponding to a range of 5 marks (except for the first one): 0 to 59.99,
60 to 64.99, 65 to 69.99, etc. In order to fix the distribution, we can propose possible
“ranges” for the percentage (or number) of students in each cohort based on the
evidence from the previous years. The final decision about what distribution to adopt
(i.e. which percentage to use for each cohort) would then lie with the body responsible
2020-07-D-2-en-1 68/79