Page 92 - BACC Report
P. 92

Draft Report on European Baccalaureate 2020


                                                    8.2( − 91.05)
                                               90 +                 ,     ≥ 91.05
                                                          7.15
                                           85 +  4.99( − 86.6) ,   86.6 ≤  < 91.05
                                                      4.4
                                                 4.99( − 82.4)
                                            80 +       4.2       ,    82.4 ≤  < 86.6
                                  () =         4.99( − 78)
                                             75 +                ,    78 ≤  < 82.4
                                                        4.4
                                                  4.99( − 72.8)
                                            70 +                  ,    72.8 ≤  < 78
                                                        5.2
                                                  9.99( − 59.8)
                                            60 +        13        ,    60 ≤  < 72.8
                                         {             ,   0 ≤  < 59.8
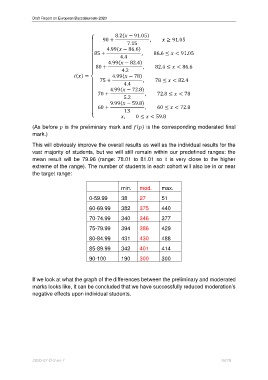
               (As before  is the preliminary mark and () is the corresponding moderated final
               mark.)

               This will obviously improve the overall results as well as the individual results for the
               vast majority of students, but we will still remain within our predefined ranges: the
               mean  result  will  be  79.96  (range:  78.01  to  81.01  so  it  is  very  close  to  the  higher
               extreme of the range). The number of students in each cohort will also be in or near
               the target range:


                                                       min.    mod.      max.
                                         0-59.99       38      27        51

                                         60-69.99      382     375       440

                                         70-74.99      340     346       377
                                         75-79.99      394     386       429

                                         80-84.99      431     430       488

                                         85-89.99      342     401       414

                                         90-100        190     300       300


               If we look at what the graph of the differences between the preliminary and moderated
               marks looks like, it can be concluded that we have successfully reduced moderation’s
               negative effects upon individual students.


               2020-07-D-2-en-1                                                                    76/79
   87   88   89   90   91   92   93   94   95