
Page 94 - BACC Report
P. 94
Draft Report on European Baccalaureate 2020
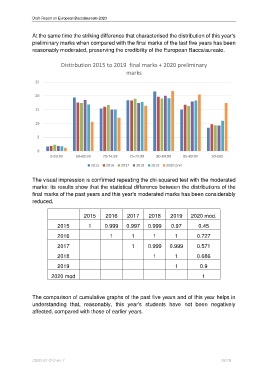
At the same time the striking difference that characterised the distribution of this year's
preliminary marks when compared with the final marks of the last five years has been
reasonably moderated, preserving the credibility of the European Baccalaureate.
Distirbution 2015 to 2019 final marks + 2020 preliminary
marks
25
20
15
10
5
0
0-59.99 60-69.99 70-74.99 75-79.99 80-84.99 85-89.99 90-100
2015 2016 2017 2018 2019 2020 prel
The visual impression is confirmed repeating the chi-squared test with the moderated
marks: its results show that the statistical difference between the distributions of the
final marks of the past years and this year's moderated marks has been considerably
reduced.
2015 2016 2017 2018 2019 2020 mod.
2015 1 0.999 0.997 0.999 0.97 0.45
2016 1 1 1 1 0.727
2017 1 0.999 0.999 0.571
2018 1 1 0.686
2019 1 0.9
2020 mod 1
The comparison of cumulative graphs of the past five years and of this year helps in
understanding that, reasonably, this year's students have not been negatively
affected, compared with those of earlier years.
2020-07-D-2-en-1 78/79