
Page 36 - BACC Report
P. 36
Draft Report on European Baccalaureate 2020
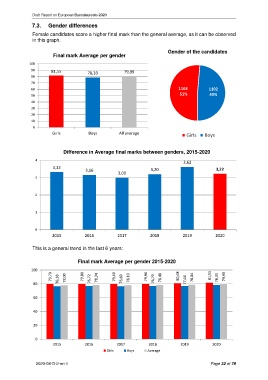
7.3. Gender differences
Female candidates score a higher final mark than the general average, as it can be observed
in this graph.
Gender of the candidates
Final mark Average per gender
100
90 81,55 78,33 79,99
80
70
60 1163 1102
51% 49%
50
40
30
20
10
0
Girls Boys All average
Girls Boys
Difference in Average final marks between genders, 2015-2020
4
3,62
3,32
3,16 3,20 3,22
3,00
3
2
1
0
2015 2016 2017 2018 2019 2020
This is a general trend in the last 6 years:
Final mark Average per gender 2015-2020
100
79,70 76,38 78,00 79,88 76,72 78,34 79,60 76,60 78,10 79,90 76,70 78,40 80,68 77,06 78,84 81,55 78,33 79,99
80
60
40
20
0
2015 2016 2017 2018 2019 2020
Girls Boys Average
2020-08-D-2-en-1 Page 32 of 79