
Page 35 - BACC Report
P. 35
Draft Report on European Baccalaureate 2020
1
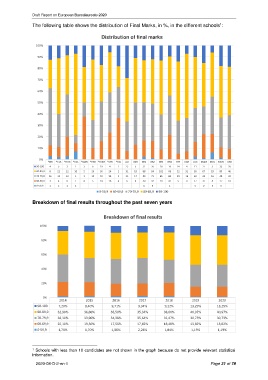
The following table shows the distribution of Final Marks, in %, in the different schools :
Distribution of final marks
100%
90%
80%
70%
60%
50%
40%
30%
20%
10%
0%
*BRI *CUL *DHG *HEL *MAN *PAR *RHM *STR *TAL ALI BER BR1 BR2 BR3 BR4 FRF KAR LUX MAM MOL MUN VAR
90-100 4 5 3 1 3 6 19 4 2 23 5 31 26 28 19 14 4 21 27 3 33 20
80-89,9 8 22 12 10 5 26 36 24 2 31 18 88 84 101 68 52 31 93 67 19 83 46
70-79,9 16 13 13 1 2 12 39 24 3 21 17 80 71 65 69 29 16 62 43 16 48 32
60-69,9 3 4 6 1 6 5 18 16 4 6 6 34 32 19 42 5 4 27 37 8 17 10
0-59,9 1 1 1 1 6 3 1 5 2 3 3
0-59,9 60-69,9 70-79,9 80-89,9 90-100
Breakdown of final results throughout the past seven years
Breakdown of final results
100%
80%
60%
40%
20%
0%
2014 2015 2016 2017 2018 2019 2020
90-100 7,20% 8,40% 9,71% 9,34% 9,22% 13,29% 13,29%
80-89,9 32,90% 36,60% 36,50% 35,34% 38,00% 40,97% 40,97%
70-79,9 38,10% 33,90% 34,38% 35,64% 32,47% 30,73% 30,73%
60-69,9 20,10% 19,50% 17,56% 17,42% 18,48% 13,82% 13,82%
0-59,9 1,70% 1,70% 1,86% 2,26% 1,84% 1,19% 1,19%
1 Schools with less than 10 candidates are not shown in the graph because do not provide relevant statistical
information.
2020-08-D-2-en-1 Page 31 of 79